Since several people have asked me about the technology behind Sipfront, I’d like to shed some light behind the scenes on the tech stack currently used to drive the service. Sipfront is currently a one man show, therefore it’s important to keep everything as simple as possible.
I tried to balance the technology stack in a way to finally use new stuff I wanted to play with since a long time while still being able to move very quickly.
Off to the cloud!
In the past, I used to self-host as many services as possible. RDBMS, Key/Value Stores, Message Queues, Email delivery, even VM Infrastructure, since it’s just an apt-get away. With all the flexibility and freedom in adapting the services to your needs comes the setup time in the short run (which fortunately is rather small in lots of cases if you’ve worked with those services in the past), but more importantly maintenance time in the mid- to long-run. Software updates, backups, tweaking, scaling, you name it.
This time around, I rather forced myself to using hosted services as much as possible to focus on the actual Sipfront service development instead of herding the backend infrastructure. You might argue that this comes with a huge cost, but then again while you don’t have tens of thousands of users, the costs are quite contained, and the value of my time spent on implementing the service is by far out-performing the cost of maintaining backend software. Eventually, when profits are high enough to cover the cost of dedicated DevOps engineers, we might optimize infrastructure costs by moving it off the cloud. The important aspect here is to not lock the technology too much into a specific platform, which actually is quite hard when looking at the compelling tools they provide. See below.
The architecture
Based on the chosen cloud approach, I deployed the service on Amazon AWS. The high level design is shown in the picture below.
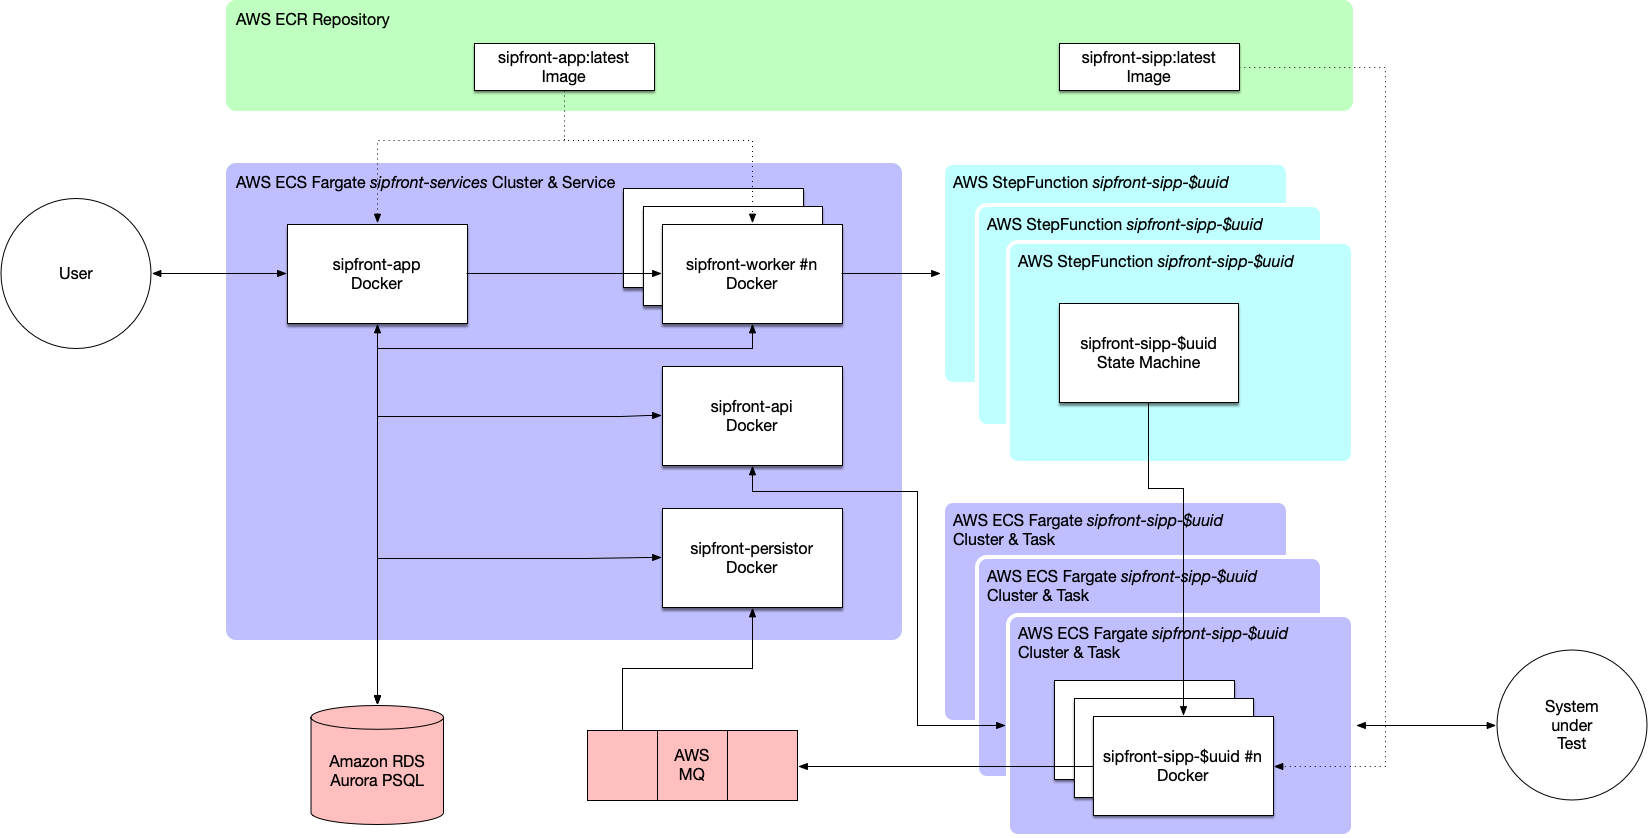
The key take-away is that all services are deployed as Docker containers in AWS Fargate. While Fargate has its annoying restrictions and limitations like for instance not being able to set ulimits for the number of open files (important when opening lots of sockets on a container) or setting net_admin privileges (required if you want to gather per-port traffic statistics using iptables log rules), it’s simple enough to do its job for now. At a later stage we might migrate to Kubernetes to get more control over the containers, but taking into account that I didn’t have too much experience running this kind of infrastructure, it would have been way of an overkill to start off.
So essentially the workflow of a test session looks like this:
-
A user starts a test session on app.sipfront.com using the dashboard.
-
The test session is created on the sipfront-app service providing the dashboard, and its configuration is persisted in the Postgres database acting as main datasource.
-
The session is dispatched to a worker queue and is picked up by a sipfront-worker instance from there
-
The worker instance creates an AWS StepFunction state machine, if necessary provisions the AWS VPC elements for networking and the Fargate Task Definition for the containers and triggers the start of the state machine.
-
The StepFunction state machine launches the containers which include the traffic generation tools.
-
Once running, the containers fetch their auxiliary files like xml scenarios, credential files etc. from the sipfront-api instances and publish their states via MQTT to the AWS MQ.
-
The traffic generation tools launch according to the test configuration and publish their metrics via MQTT.
-
The sipfront-persistor instance picks up published metrics from the message queue and persist them into the main DB.
-
On the dashboard, the sipfront-app instance polls for new metrics of the test session via a websocket connection and paints them on the report page by updating graphs and tables.
-
Once the traffic generation tools end, they wind down the container instances by notifying their peers via MQTT, and the Fargate cluster is cleaned up.
Web technologies
All components except for the traffic generation tools are written in Perl. This might sound a bit ancient, but it’s the programming language I know best and which I’m using most since 20 years, so I get things done very quickly.
Web components like sipfront-app and sipfront-api are created using the Mojolicious Framework, while the main website is served as static files stitched together using the [Perl Template Toolkit] (http://www.template-toolkit.org/) to avoid redundant HTML code for different pages. This blog section right here is powered by Hugo to generate static pages from Markdown content.
The web containers are then exposed via AWS Load Balancers, which also handle the TLS certificates.
VoIP technologies
The traffic generation tool currently in use is [SIPp] (https://github.com/SIPp/sipp) with custom patches for MQTT support, while the service is built in a way that any tool able to run in a Docker container and publishing its metrics via MQTT can be used.
SIPp is extremely powerful if used properly and can generate a huge amount of signaling traffic.
The media generation to support audio and video streams and being able to gather the audio quality is currently in the build stage at the time of writing. The tools used here will be Kamailio as a control daemon for rtpengine, which can be used to inject media into the calls.
Deployment strategies
Since all components are deployed in AWS and are running in Docker containers, I’ve built a CI/CD pipeline using AWS CodePipeline.
I’m keeping the git main branch of the various components, which reside in private Github repositories, clean and production ready, so each push to main on Github will trigger via a web hook the corresponding AWS CodePipeline code.
The pipeline is then invoking a Source step fetching the source code, a Build step creating the Docker container and pushing it towards the AWS ECR, and a Deploy stage to replace the Fargate task with a new one based on the newly created container.
Observability
At the moment, I use AWS CloudWatch to collect and present all container logs and metrics. This is probably the biggest source of improvement to tackle next, as it’s really clumsy and is not providing all metrics one would expect (load, anyone?). Therefore I’m leaning to a Prometheus based solution here in the near term.
Infrastructure as code
I’m currently working on packing the whole infrastructure into AWS CloudFormation definitions, so I can easily spin up completely new instances of the full stack. This is important for me to have development, staging and production environments cleanly separated.
This concludes the peek behind the scenes and sheds some lights on how Sipfront is built. If you have any comments and suggestions, let me know at Twitter.